 .
.Mica2Dot sensors with weather boards collected timestamped topology information, along with humidity, temperature, light and voltage values once every 31 seconds. Data was collected using the TinyDB in-network query processing system, built on the TinyOS platform.
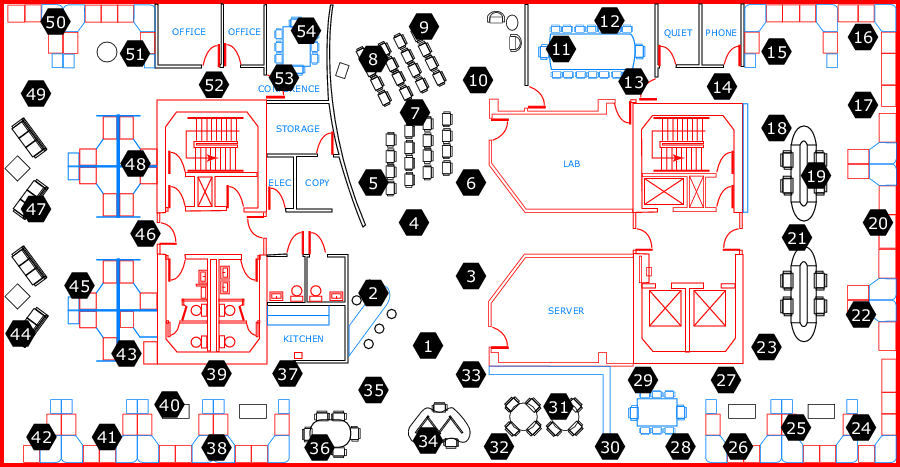
The sensors were arranged in the lab according to the diagram shown below:
.
The x and y coordinates of sensors (in meters relative to the upper right corner of the lab) are given in this file. The three columns correspond to mote id, x location, and y location.
This file includes a log of about 2.3 million readings collected from these sensors. The file is 34MB gzipped, 150MB uncopressed. The schema is as follows:
| date:yyyy-mm-dd | time:hh:mm:ss.xxx | epoch:int | moteid:int | temperature:real | humidity:real | light:real | voltage:real |
In this case, epoch is a monotonically increasing sequence number from each mote. Two readings from the same epoch number were produced from different motes at the same time. There are some missing epochs in this data set. Moteids range from 1-54; data from some motes may be missing or truncated. Temperature is in degrees Celsius. Humidity is temperature corrected relative humidity, ranging from 0-100%. Light is in Lux (a value of 1 Lux corresponds to moonlight, 400 Lux to a bright office, and 100,000 Lux to full sunlight.) Voltage is expressed in volts, ranging from 2-3; the batteries in this case were lithium ion cells which maintain a fairly constant voltage over their lifetime; note that variations in voltage are highly correlated with temperature.
Finally, we have aggregate connectivity data averaged over all time. This data consists of sender id, receiver id, and probability of a message from a sender successfully reaching a receiver. Note that this is not a symmetric relationship -- sensor A may hear B better than B hears A.
Permission is granted to use or reproduce this data in any format or venue, although we request that you acknowledge our hard efforts in any published work.
We make no warranties as to the quality or accuracy of any of the data linked from this page.